
Which No-Shows Are Actually Costing Your Clinic?
Most clinics know their no-show rate. Fewer know which no-shows actually cost them money.
A 12% no-show rate sounds like a single problem, but it usually hides several different ones. A missed new-patient visit is not the same as a missed follow-up. A Medicare slot is not the same as a commercial slot. A no-show at 8:00 a.m. may be easier to recover than one in the middle of a fully booked provider session.
The business question is: which missed appointments are creating the most revenue leakage and capacity waste, and what should the clinic change first?
This is the kind of problem that fits an Answer engagement: one focused analysis, a clear recommendation, and no new software platform required. The average U.S. dental practice loses an estimated $105,000+ a year to missed appointments. A few weeks of focused analysis on data you already have can recover a meaningful share of it.
You already have the data—and you don’t need PHI
Clinics sit on years of scheduling and billing history. That is more than enough raw material for a serious analysis, and you don’t have to hand over protected health information to do it.
A HIPAA Safe Harbor de-identified extract is enough. Safe Harbor strips the 18 direct identifiers—names, addresses, phone numbers, exact dates of birth, account and insurance numbers—and reduces any service date to the year. Everything this analysis needs survives that cut: provider, location, visit type, status, payer category, coarse patient attributes (new vs. established, age band, broad geography), and how far ahead the visit was booked (a duration, not a date). No breach risk, no new vendor security review, and the findings are just as sharp.
That last point is worth being strict about: this project carries no calendar dates, times, or even day-of-week—nothing finer than a year and nothing that could re-identify a patient. The leakage findings hold up entirely on what’s left.
There is a second advantage. Because the schedule is full of natural variation—reminders that did or didn’t go out, slots booked far ahead versus same-week, different visit types stacked on different days—your own history behaves like a natural experiment. You don’t need an industry benchmark. The patterns are fit specifically to your clinic, your payers, and your templates.
The data used
The analysis usually starts with exports the practice already has:
- Appointment schedule: date, time, provider, location, visit type, status
- Patient and visit attributes: new vs. established, referral source, payer, service line
- Billing data: charges, allowed amounts, collections, denials, write-offs
- Operational context: provider templates, room constraints, reminder timing, cancellation window
The point is not to build a perfect prediction model on day one. The point is to connect missed appointments to the business consequences operators actually care about: lost revenue, unused capacity, downstream scheduling pressure, and staff time spent filling gaps manually.
A worked example
To make this concrete, I built a synthetic but realistic dataset modeled on a multi-site outpatient clinic—about 56,000 appointments across a year, three locations, and seven providers—using only strict Safe Harbor fields: no names, no addresses, no calendar dates, just state, gender, ethnicity, age, year of birth, and the operational attributes of each visit. The numbers below are illustrative, but the workflow is exactly what a real engagement looks like.
At the headline level, this clinic looks ordinary: a 12.9% no-show rate. Most slots are kept; the misses split across no-shows and a smaller set of cancellations.
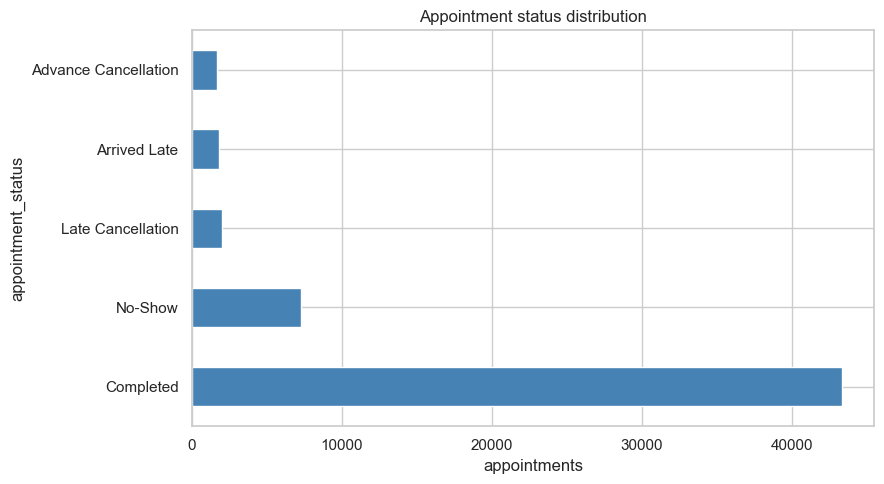
The headline composition is visible, but this view still does not tell you which misses hurt the business most.
Underneath that single number, the missed revenue is highly concentrated by visit type:
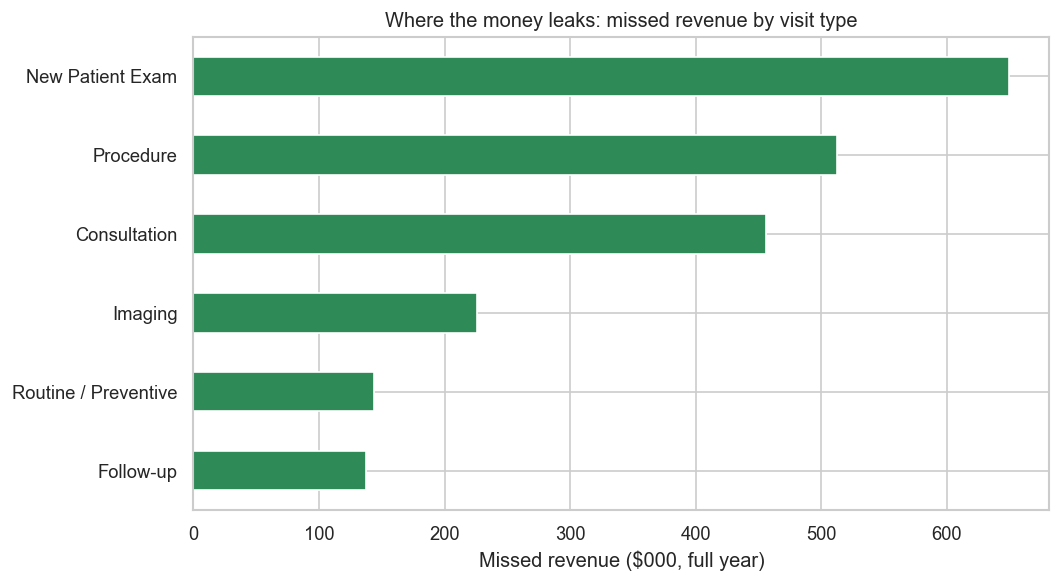
A handful of visit types carry most of the leakage. New-patient exams lead by a wide margin.
| Visit type | Missed revenue (year) |
|---|---|
| New Patient Exam | ~$649,000 |
| Procedure | ~$513,000 |
| Consultation | ~$456,000 |
| Imaging | ~$226,000 |
| Routine / Preventive | ~$144,000 |
| Follow-up | ~$137,000 |
This is the volume-versus-impact gap in action. Follow-ups are the most common appointment, but they leak the least revenue. New-patient exams are comparatively rare and leak the most—because new patients no-show more than twice as often as established ones (about 21% vs. 9%), and those slots are worth more.
Other factors compound it: reminders cut the no-show rate by several points, longer booking lead times raise it, and Medicaid slots miss more often than commercial ones.
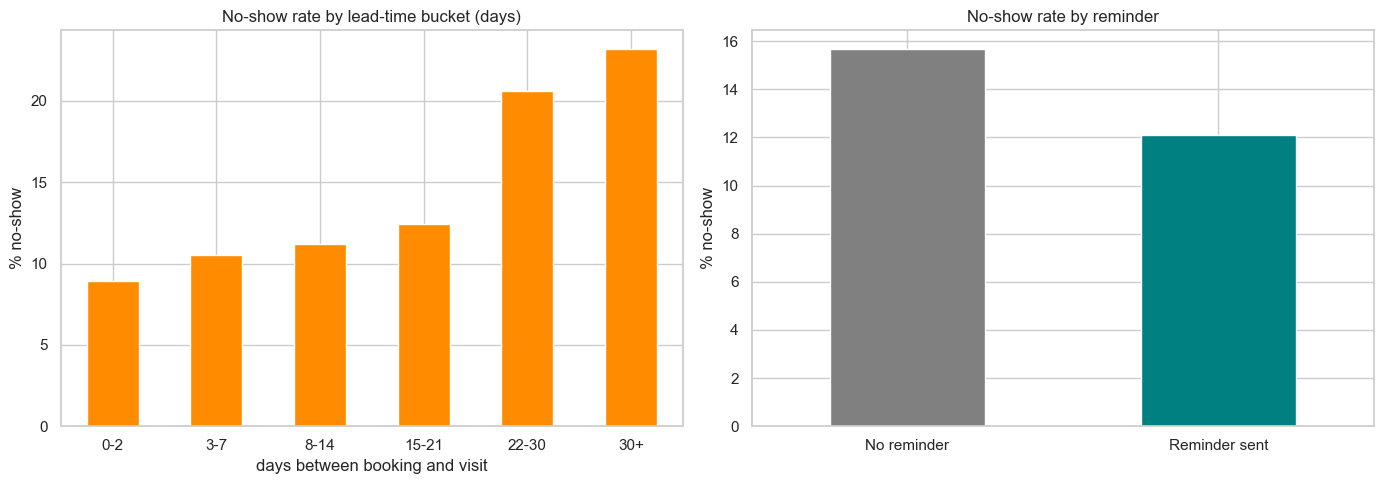
Longer lead times raise no-show risk, while reminders lower it. Both are operational levers the clinic can adjust without buying a new platform.
What actually moves the needle
Cross-tabs show where misses happen, but not which factor drives the most dollars once everything is weighed together. The dominant driver, by a wide margin, was visit type—it accounted for roughly 45% of the variation the model could explain, more than payer, reminders, lead time, and service line combined. New-patient exams carried about 1.7× the expected leakage of an average visit; being a new patient or having no reminder each added roughly another 35–45%. Follow-ups, routine visits, and imaging leaked far less.
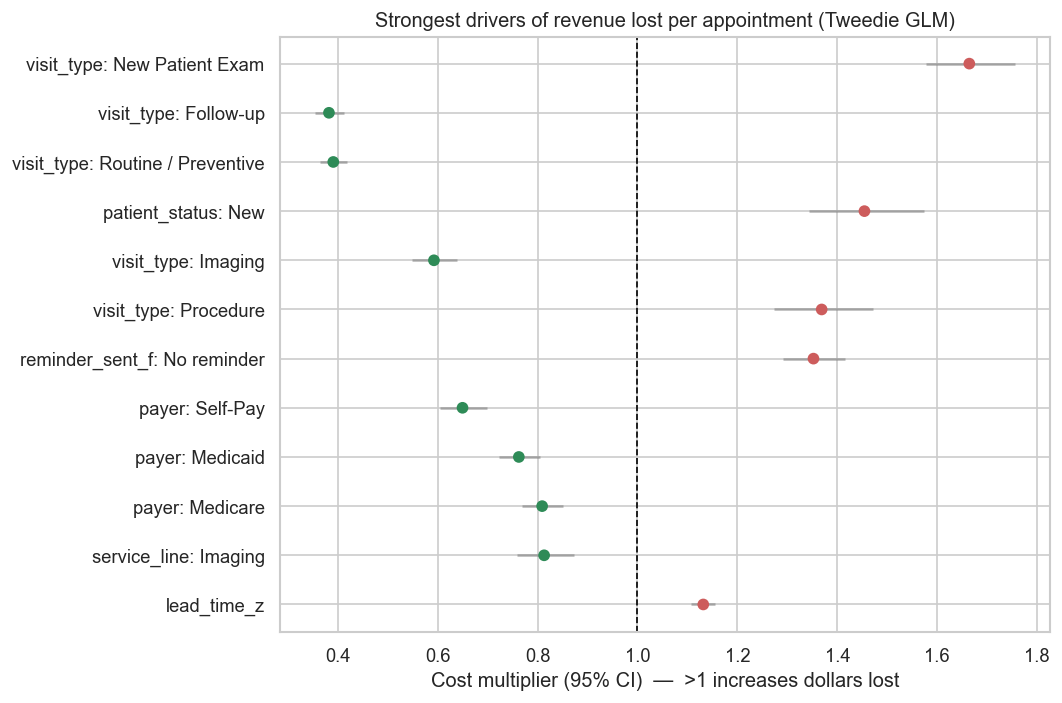
Cost multipliers above 1 increase expected dollars lost; below 1 reduce it. New-patient exams, new patients, and missing reminders rise to the top; routine and follow-up visits fall to the bottom.
Modeling dollars also corrects a tempting mistake. Medicaid slots have a higher no-show rate, but they leak fewer dollars than commercial slots because the allowed amounts are smaller—so optimizing on the rate alone would send the team chasing the wrong slots. The practical reading: change how you schedule and confirm appointments by visit type and value—not by tacking generic reminders onto everything equally.
Methodology
Since the business cares about revenue, I modeled the dollars lost per appointment directly with a Tweedie regression—a model built for outcomes that are exactly zero for most records (kept slots) and a skewed positive amount for the rest (misses). It folds together how often a slot is missed and how expensive that miss is.
What to look for
A useful no-show analysis should separate volume from impact. The most common missed visit type is not always the most expensive one.
The first pass should answer questions like:
- Which visit types generate the most missed revenue?
- Which providers or locations have the highest unrecovered capacity?
- Are late cancellations more damaging than no-shows?
- Do no-shows cluster by referral source, payer, patient type, or appointment lead time?
- Which slots are realistically recoverable through waitlists, reminders, or targeted overbooking?
That last question matters. A report that says “Provider A has the highest no-show rate” is descriptive. A decision-support analysis should say, “New-patient exams on commercial plans are high-value, high-risk, and often unrecovered. Start there.”
What the analysis enables
The output should be a ranked action list, not a dashboard full of percentages.
Examples of decisions this analysis can support:
-
Target reminders where they pay off. Use enhanced reminders for visit types with high missed-revenue impact, not every appointment equally.
-
Adjust overbooking rules carefully. Some slots can tolerate a small overbook buffer. Others create bottlenecks when everyone arrives.
-
Protect high-value access. New-patient or procedure-related visits may need different confirmation workflows than routine follow-ups.
-
Fix scheduling templates. If no-shows concentrate in specific lead-time windows or provider sessions, the template may be creating part of the problem.
-
Measure recovery, not just absence. A missed appointment that gets refilled from a waitlist is operationally different from an empty slot.
The project can look complicated from the inside, but the end product is the opposite: it simplifies operations. Instead of relying on ad-hoc, frustrating scheduling tricks, you get a small set of clear rules grounded in your own data. The goal is to reduce the financial stress of scheduling so the team can focus on the patient in the chair, not the gap in the calendar.
Who should care
This matters for outpatient clinics, specialty practices, therapy groups, imaging centers, dental groups, and any care-adjacent operator where schedule capacity is the business. If you already track no-shows but still make staffing, reminder, and overbooking decisions by gut feel, the next step is not another report. It is a decision-ready analysis that shows where the leakage is and what to change first.
And once you know which appointments carry the most risk, there’s a natural next step: turning that into a simple at-a-glance score the front desk could use when booking, so the highest-risk, highest-value slots get the right attention before they ever become a no-show. That’s a follow-on for another day—but it starts with the answer.