
IKEA Opens in Alabama: How Much Revenue Is at Risk for Birmingham Furniture Retailers?
On February 25, 2026, IKEA opened its first Alabama location in Huntsville, roughly 100 miles north of Birmingham. For Birmingham furniture retailers, that is not just retail news. It is a planning question: a national brand with strong price recognition, broad inventory, and destination-store appeal is now close enough to influence some local buying decisions.
The business question is: how much revenue is plausibly at risk, and which customer segments should a local retailer defend first?
This is not a prediction of doom. IKEA and local furniture retailers serve meaningfully different segments, and distance and brand loyalty create real friction. But pretending there is no impact would also be weak planning. The goal is a transparent baseline that lets an operator stress-test assumptions before making marketing, staffing, or inventory decisions.
The data used
For this public write-up, I used a synthetic-but-calibrated Birmingham-area furniture sales series covering January 2018 through December 2025. That makes this a methodology demo, not a claim about any single retailer’s actual books. In a client engagement, the same workflow would be pointed at store-level revenue, transaction, inventory, and customer data.
The baseline uses economic drivers that plausibly move furniture demand:
- Housing starts — the single strongest signal; move-in and replacement buyers both track new construction
- Unemployment rate — consumer spending confidence proxy
- Consumer confidence index — discretionary purchase sensitivity
- Mortgage rate — affects both new-buyer volume and existing-homeowner equity/refinance behavior
- Cyclical seasonality — monthly patterns in replacement and move-in purchasing
- Linear time trend — captures the slow secular growth in the market
The IKEA disruption overlay
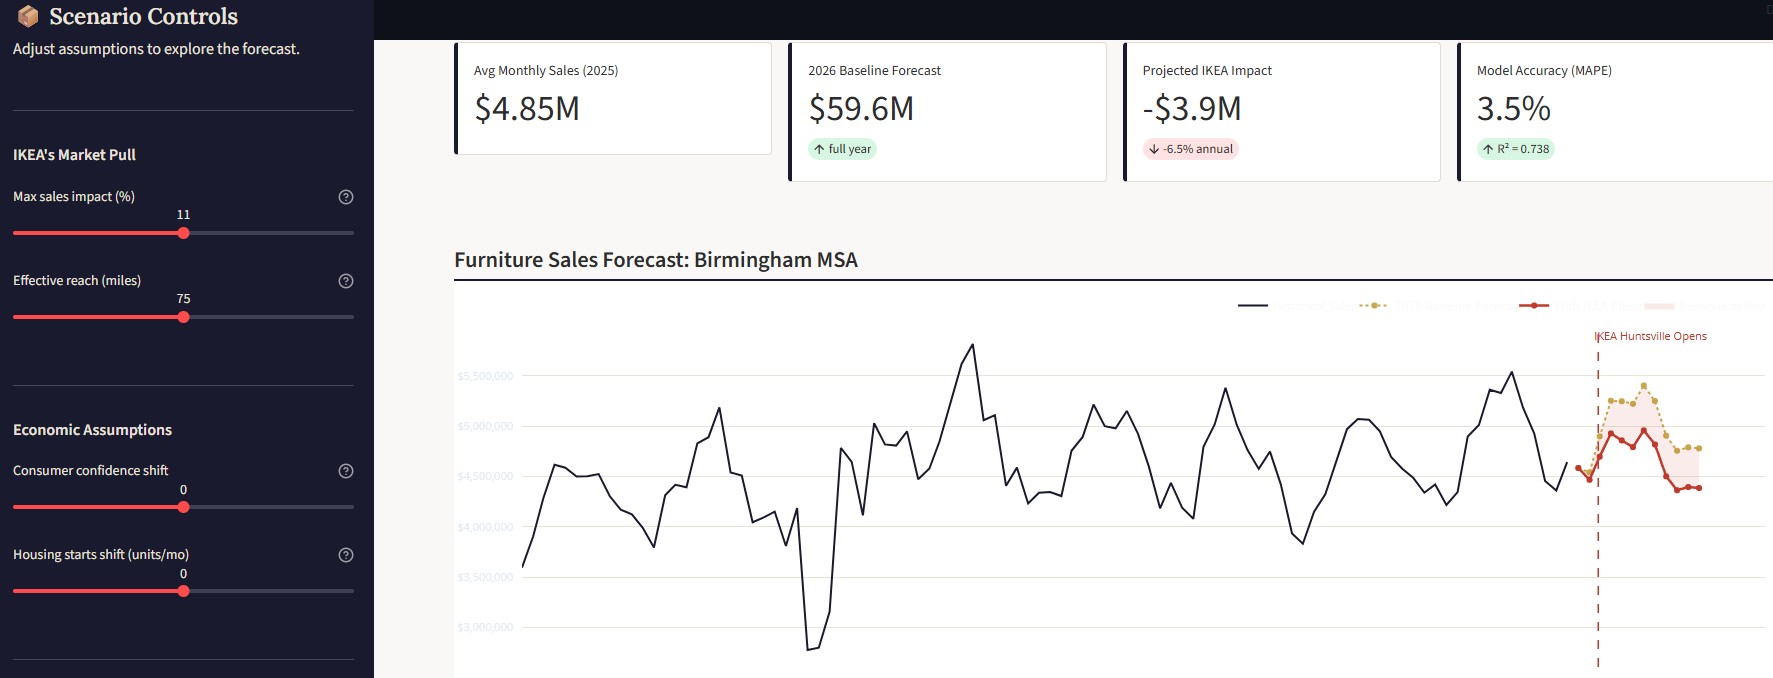
The baseline 2026 forecast is what Birmingham retailers would expect absent any new competition. The IKEA impact is then modeled as a separate overlay:
- Market pull factor: the share of baseline revenue that IKEA is capable of drawing away at full effect, adjustable from 2% to 20% (default 8%)
- Distance factor: Birmingham is ~100 miles from Huntsville; the tool scales the effect by reach radius (default 90 miles, adjustable from 30 to 120)
- Ramp-up curve: IKEA’s impact doesn’t hit full strength on day one. The model applies a six-month linear ramp (20% of full effect in February, 50% in March, 75% in April, 90% in May, 100% from June onward), reflecting realistic consumer awareness and habit-formation timelines
The gap between the baseline and IKEA-scenario forecasts is the revenue at risk: the range that conservative planning should account for.
Segment risk
Not all of Birmingham’s furniture retail base is equally exposed. I mapped the six main customer archetypes against IKEA’s core strengths:
| Segment | Risk | Rationale |
|---|---|---|
| First-time buyers | High | IKEA’s price point and complete-room bundles directly target this cohort |
| Move-in shoppers | High | New residents making first-purchase decisions are the most susceptible to brand discovery |
| Replacement buyers | Medium | Price-sensitive on commodity items; less so on upholstery and larger pieces |
| Custom / upholstery | Low | IKEA does not compete on custom work or fabric selection |
| Business / commercial | Low | Lead times, white-glove delivery, and account relationships favor local providers |
| Luxury / designer | Very low | Entirely different price-and-taste positioning |
The decision it enables
Rather than publish a single static estimate, I built the model into an interactive tool so that retailers and consultants can adjust the key assumptions: market pull strength, reach radius, consumer confidence, and housing activity. The revenue-at-risk calculation updates in real time as assumptions change.
The point is to support a decision, not admire a forecast. The model points toward a few concrete strategic levers:
-
Double down on the segments IKEA doesn’t serve. Custom upholstery, commercial accounts, and designer-tier goods are the moat. Retailers that have been treating custom work as a secondary offering should consider making it a front-door pitch.
-
Accelerate the relationship with first-time buyers before they form the IKEA habit. The ramp-up curve means the window is narrow—the next six to twelve months are when new buyers in Birmingham will decide whether to drive to Huntsville or shop locally. Targeted outreach (move-in lists from the MLS, new-construction permits) matters now more than it did last year.
-
Watch housing starts. Housing activity is the dominant driver of furniture demand. If Birmingham’s construction pace holds, the market is large enough that both IKEA and local retailers can grow. If starts slow, the competitive pressure concentrates.
Who should care
This kind of analysis is useful for operators facing a new competitor, new location, payer mix shift, referral source change, or market event that may change demand. Furniture retail is the example here, but the decision-support pattern applies to clinics, outpatient groups, and operations-heavy SMBs: build a baseline, model the disruption, identify the exposed segments, and decide where to act first.
Methodology
The forecast uses a time-based train/validation split—the last 12 months held out—so there is no data leakage from future periods into the model. Validation on the held-out year showed MAPE below 5% and R² above 0.85, sufficient for directional planning. Feature importance rankings and full validation details are visible in the tool’s expandable Model Details section.
Facing a competitive shift or demand disruption? Start with a 45-minute Data & Operations Audit