
Birmingham MSA Business Penetration: How the Metro Compares to Peer MSAs
How does the Birmingham-Hoover metro’s business landscape compare to similar metros? In the Brookings report Birmingham’s Tipping Point (2021), the region is described as at a crossroads: either tip toward inclusive prosperity—buoyed by efforts like the Switch innovation district, Birmingham Promise, HealthTech, and Black-owned business acceleration—or lapse into the same structural headwinds that left Birmingham with the second-lowest job growth among large metros after the Great Recession and the worst racial disparities in business ownership. A central theme of that work is job creation: the region needs more growth in dynamic, tradable industries and in young and scaling businesses, not only in locally serving sectors. Knowing where Birmingham’s industry mix stands relative to a set of peer metros is one way to ground that conversation in data.
I used U.S. Census Bureau County Business Patterns (CBP) data to measure business penetration—establishments per 10,000 people—by NAICS 3-digit subsector for the Birmingham MSA and the aggregate of 14 peer MSAs: Indianapolis, IN; Baton Rouge, LA; New Orleans, LA; Kansas City, MO-KS; Buffalo, NY; Rochester, NY; Cleveland, OH; Memphis, TN-MS-AR; Virginia Beach, VA-NC; Richmond, VA; Milwaukee, WI; Louisville, KY-IN; Nashville, TN; and Huntsville, AL. Same methodology, same year (2023), so the comparison is apples-to-apples. The result is a snapshot of which subsectors Birmingham is over- or under-represented in relative to those peers. That doesn’t tell the full story (ownership, job quality, and firm age matter too), but it does show whether the metro’s business mix looks more like the peer average or skewed toward certain industries—information that matters for economic development, talent strategy, and the kind of inclusive growth the Brookings report and efforts like Prosper are aiming for.
Peer metros. Birmingham is compared to the aggregate of these 14 MSAs: Indianapolis, IN; Baton Rouge, LA; New Orleans, LA; Kansas City, MO-KS; Buffalo, NY; Rochester, NY; Cleveland, OH; Memphis, TN-MS-AR; Virginia Beach, VA-NC; Richmond, VA; Milwaukee, WI; Louisville, KY-IN; Nashville, TN; and Huntsville, AL. Each is a similar-scale or regionally relevant metro, so the comparison highlights where Birmingham’s industry mix aligns or diverges from these peers rather than from the very largest U.S. metros.
Data and definitions: CBP provides establishment and employment counts by industry and geography. I pulled 2023 CBP at the MSA level, matched it with ACS population for the 14 peer MSAs and Birmingham, and computed penetration as (establishments / population) × 10,000. Industries are NAICS 3-digit (subsectors). Birmingham-Hoover is MSA code 13820; it is included in the Birmingham slice and excluded from the peer aggregate when comparing.
Headline findings:
- Over-represented: Birmingham’s highest penetration ratios vs. the peer average are in forestry and logging (4.4×), mining (except oil and gas) (2.5×), primary metal manufacturing (2.1×), lessors of nonfinancial intangible assets (1.9×), and wholesale electronic markets and agents and brokers (1.8×). Also well above average: nonmetallic mineral product manufacturing, gasoline stations, publishing industries, electrical equipment and appliance manufacturing, wood product manufacturing, health and personal care stores, general merchandise stores, furniture and home furnishings stores, credit intermediation, religious and grantmaking organizations, utilities, merchant wholesalers of durable goods, heavy and civil engineering construction, and telecommunications—reflecting the metro’s natural-resource, manufacturing, and brick-and-mortar retail base.
- Under-represented: The metro runs below the peer average in oil and gas extraction (0.22×), textile product mills (0.36×), computer and electronic product manufacturing (0.37×), paper manufacturing (0.45×), transit and ground passenger transportation (0.46×), plastics and rubber products manufacturing (0.46×), performing arts, spectator sports, and related industries (0.49×), apparel manufacturing (0.51×), nursing and residential care facilities (0.52×), beverage and tobacco product manufacturing (0.53×), scenic and sightseeing transportation (0.54×), and motion picture and sound recording industries (0.56×). Also below average: warehousing and storage, machinery manufacturing, couriers and messengers, administrative and support services, data processing and hosting, and professional and technical services—typical for a mid-sized Southern metro vs. the aggregate of these peers.
- Overall: The average ratio (Birmingham / peer average) across all NAICS 3-digit subsectors in this run is 1.03—so Birmingham has about 3% more business establishments per capita than the peer average overall, with 33 subsectors over-represented and 48 under-represented.
Why this analysis matters: The Brookings report argues that Birmingham’s recovery and long-term transformation depend on job creation in the right kinds of industries—startups, “missing middle” businesses that scale, and clusters like HealthTech that sell beyond the local market. Penetration is a simple proxy for industry mix: where Birmingham is over-represented, the metro has more establishments per capita than the peer average; where it’s under-represented, it has fewer. The pattern we see—strong in natural resources, manufacturing, and some locally serving sectors; weaker in information, professional and technical services, performing arts, and logistics—lines up with the report’s point that the region has not yet replaced the industries that once drove growth with enough new, tradable-industry dynamism. That doesn’t mean the over-represented sectors are “bad” or the under-represented ones “good” in isolation; it means that if the goal is to tip toward inclusive prosperity, strategies that target job creation (startups, HealthTech, Black-owned business acceleration, business advisory services) can use this kind of benchmark to see where the metro already has density and where there’s room to grow.
The charts below summarize the comparison: where Birmingham is over- or under-represented (ratio > 1 or < 1), the scatter of Birmingham vs. peer average penetration by industry, and the full percentage difference by industry.
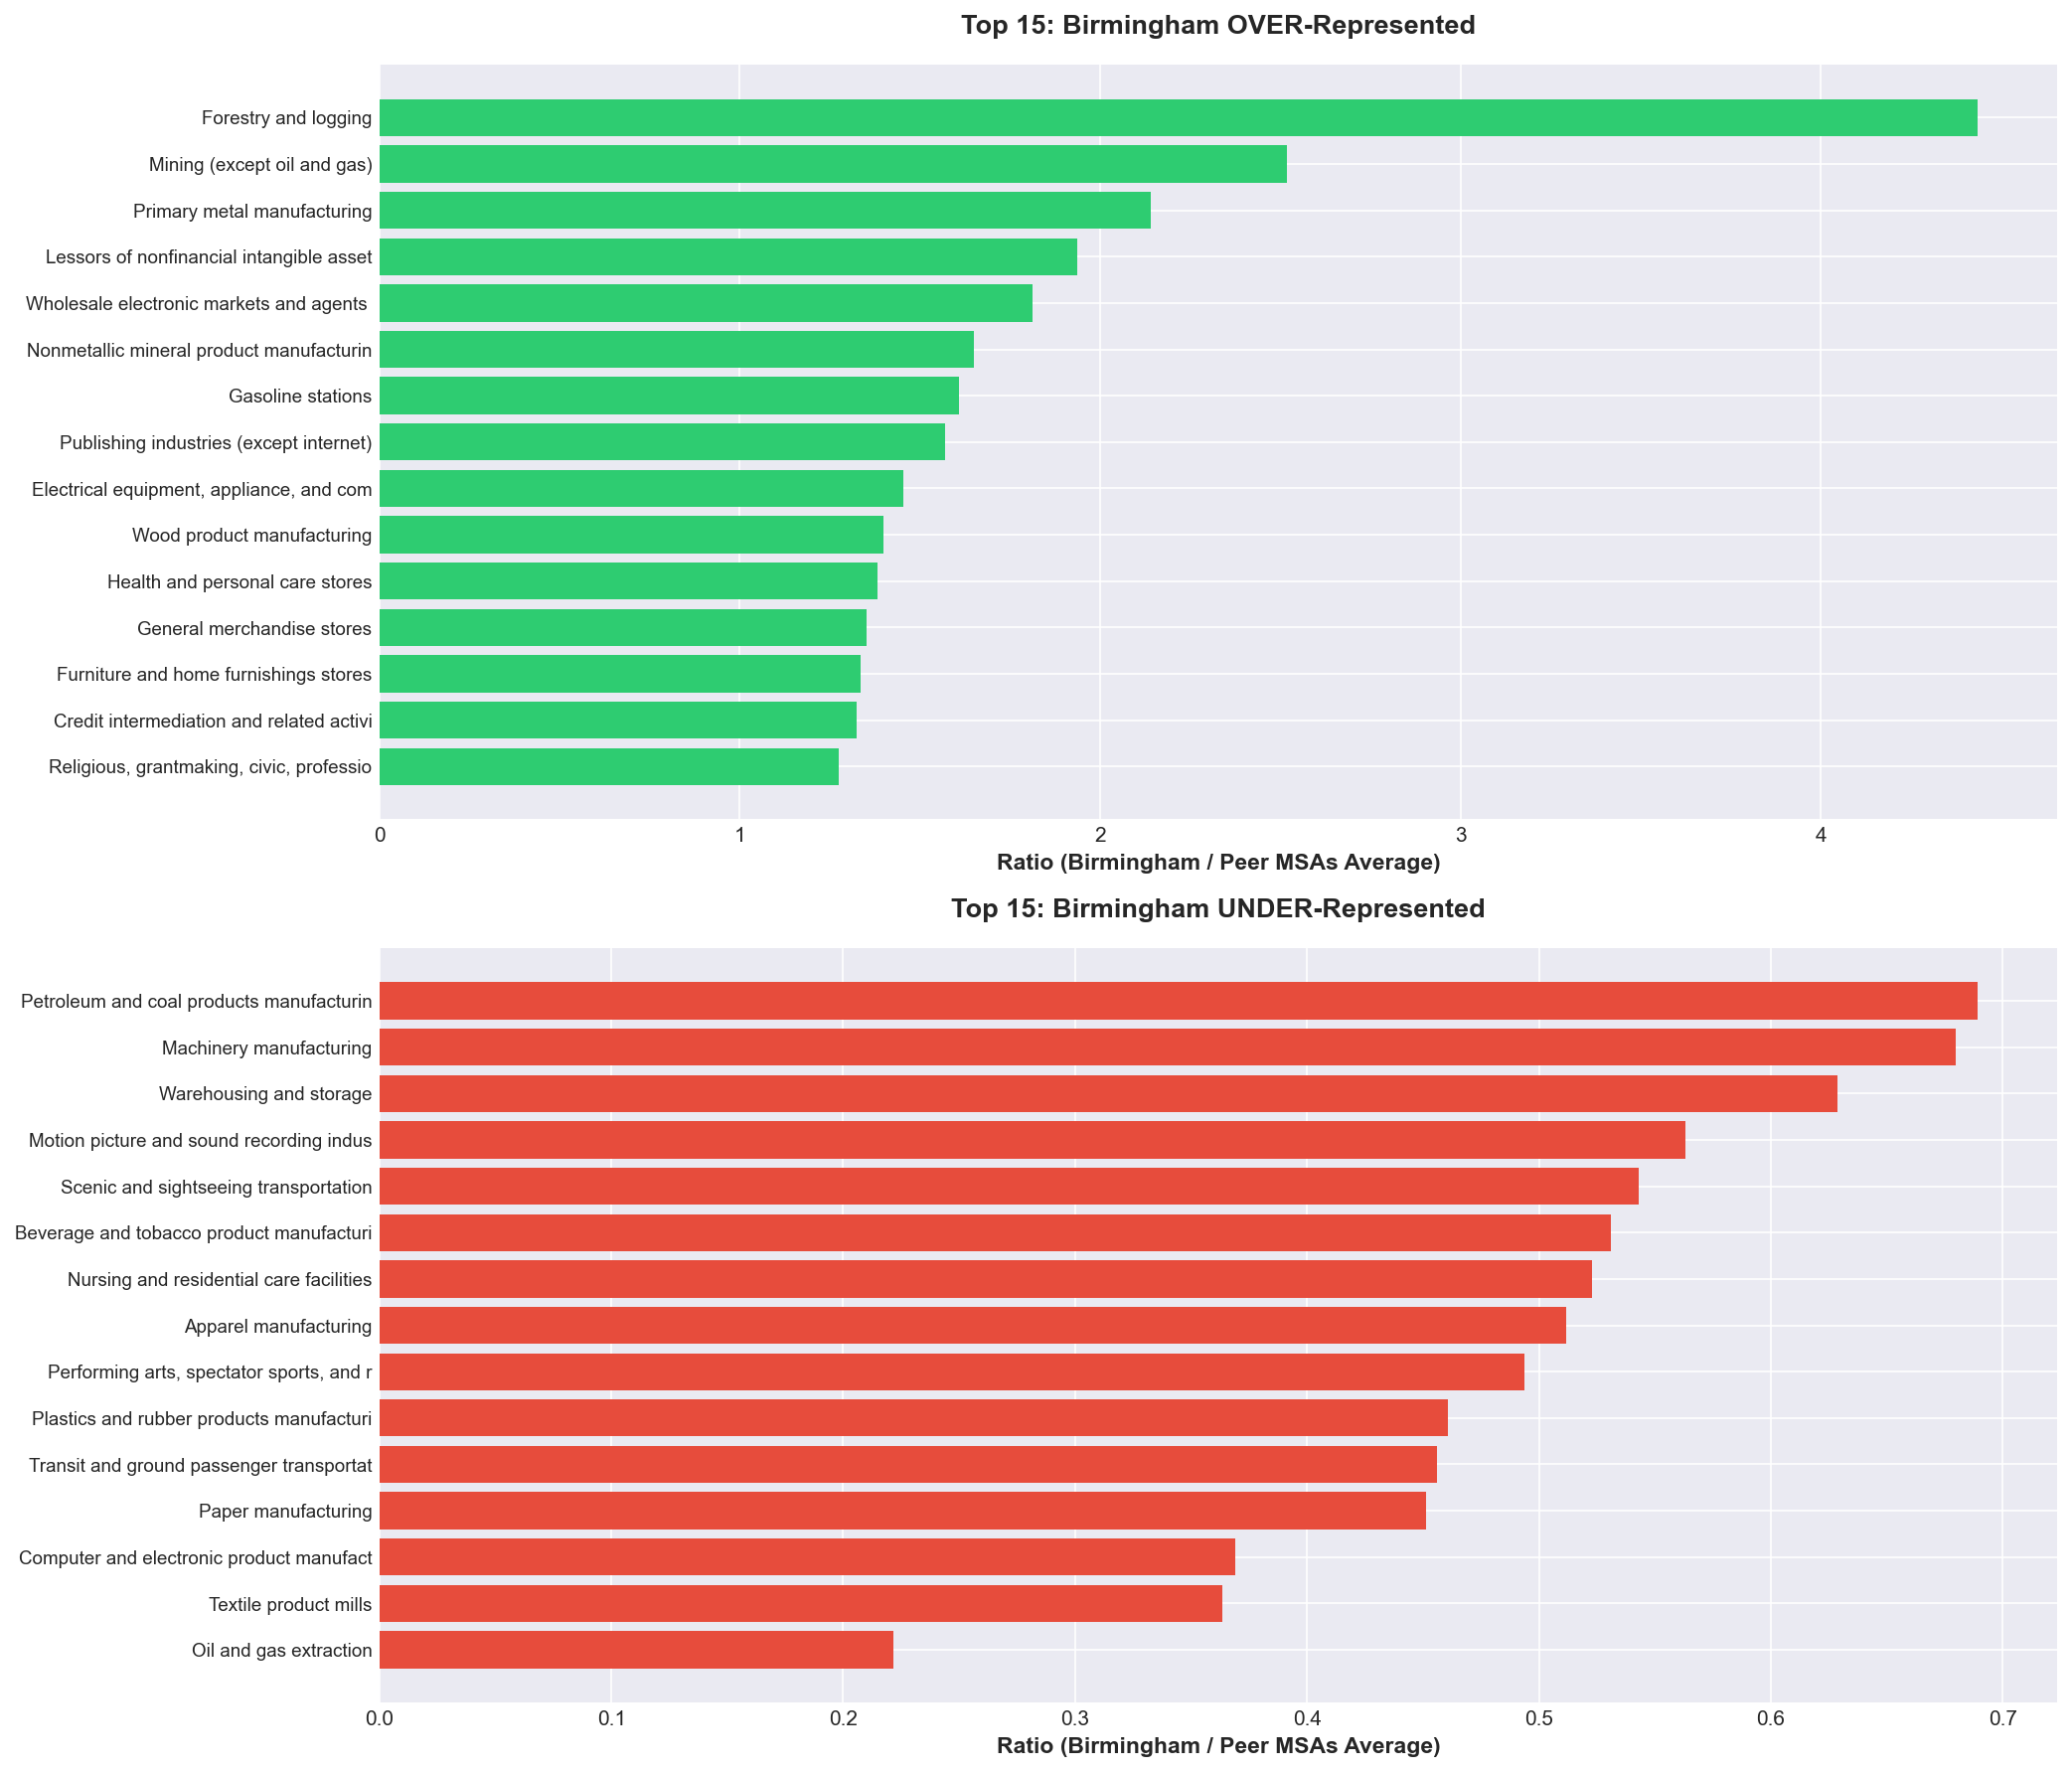
Green: over-represented (ratio > 1). Red: under-represented (ratio < 1).
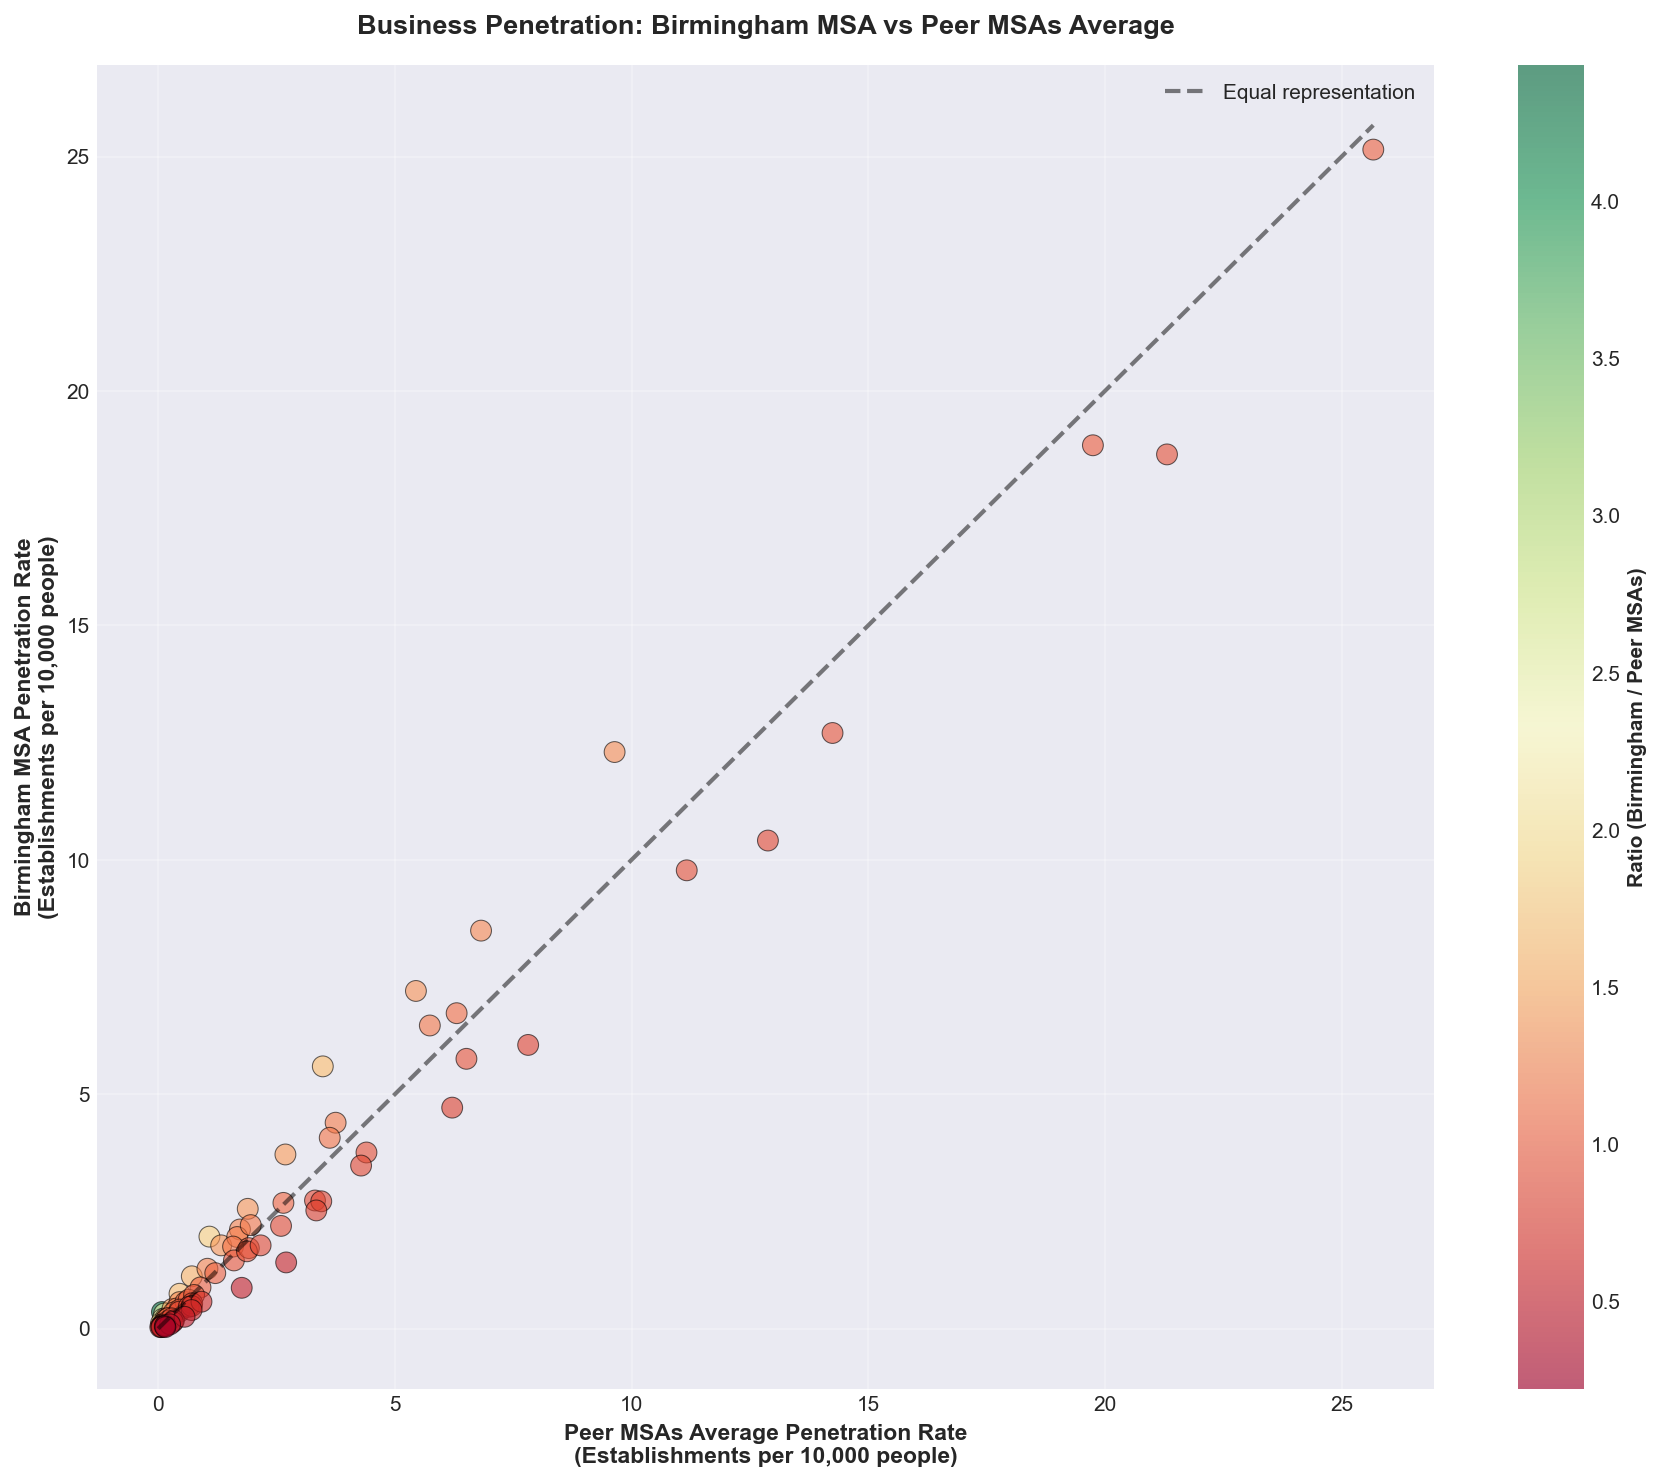
Points above the diagonal line indicate higher penetration in Birmingham than in the peer average.